Push notifications can boost app engagement by 88% and improve retention rates by 3 to 10 times, but only if you track the right metrics. Without proper analysis, you're guessing what works and risking opt-outs or uninstalls. Here's what you need to know:
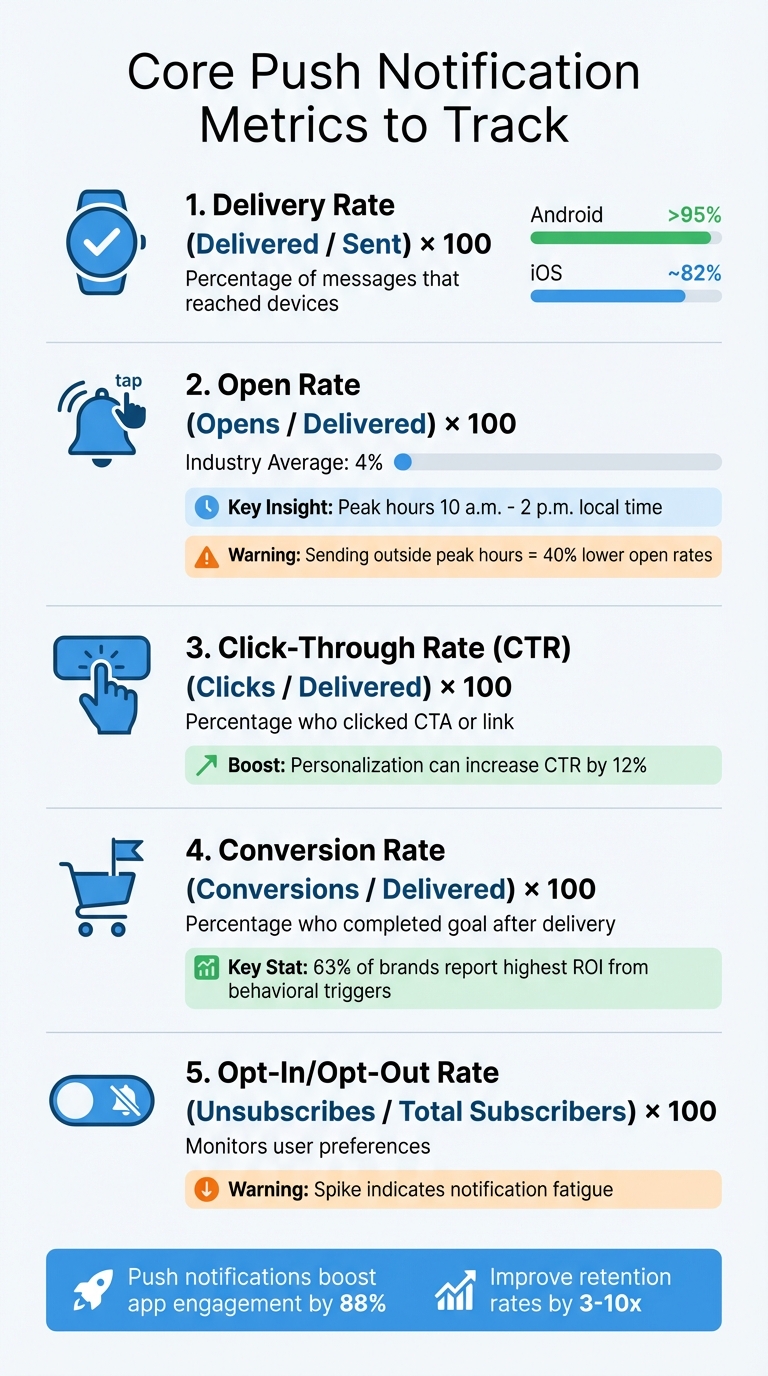
- Delivery Rate: Shows how many notifications reach user devices. Aim for over 95% on Android and around 82% on iOS.
- Open Rate: Tracks how many users tap your notifications. The average is only 4%, so timing (10 a.m. to 2 p.m. local time) is key.
- Click-Through Rate (CTR): Focuses on users interacting with your notification’s content.
- Conversion Rate: Measures how many users complete a goal (e.g., purchase) after engaging with your notification.
- Opt-In/Opt-Out Rates: Monitors user preferences to avoid notification fatigue.
Advanced metrics like Retention Impact, Error Rate, and Revenue per Notification provide deeper insights into user behavior and campaign performance. To improve results, prioritize notification best practices like personalization, A/B testing, and timing optimization. For example, tailored notifications can increase CTR by up to 12%, while behavioral triggers yield the highest ROI for 63% of brands.
Tracking these metrics ensures your notifications drive meaningful engagement and avoid becoming just another distraction.
How to Track Push Notification Outcomes in OneSignal
sbb-itb-e3aed85
Core Metrics to Track
Push Notification Metrics: Key Performance Indicators and Benchmarks
When measuring the effectiveness of your push notifications, start with these five essential metrics. They’ll help you understand whether your messages are reaching users, grabbing their attention, and inspiring action through effective communication tools.
Delivery Rate tells you the percentage of notifications that successfully made it to users' devices. To calculate, divide the number of delivered notifications by the total sent, then multiply by 100. For reference, Android often achieves above 95%, while iOS hovers around 82%. It’s important to note the distinction between "Delivered" and "Confirmed Delivery." The former refers to what push services like FCM or APNs report as accepted, while the latter requires your platform’s SDK to verify the notification actually reached the device.
"Delivered reflects what the push service (FCM, APNs) reported - it accepted the message for delivery. Confirmed Delivery requires the OneSignal SDK on the device to report back, which only happens if the device is online and the app processes the notification." - OneSignal
Open Rate measures the percentage of users who tapped on your notification after receiving it. This metric helps you gauge how well your message resonates. Industry averages sit at just 4%, but timing is crucial - sending notifications outside peak hours (typically 10 a.m. to 2 p.m. local time) can lower open rates by as much as 40%. Keep in mind that Android and iOS handle notifications differently: Android keeps them visible until dismissed, while iOS moves them to the message center after one display, often resulting in fewer recorded opens.
Click-Through Rate (CTR) tracks the percentage of users who clicked on your notification’s link or call-to-action. While often used interchangeably with open rate in push notification marketing, CTR focuses specifically on user interaction with the notification’s content.
Conversion Rate measures how many users completed a desired action - like making a purchase or upgrading a plan - after engaging with your notification. This metric is critical because it directly ties your messaging to business outcomes like revenue or growth.
Opt-In and Opt-Out Rates reflect how many users choose to enable or disable your notifications. A spike in opt-outs could indicate you’re sending too many notifications or that your content isn’t relevant enough. Monitoring these rates helps you maintain a healthy subscriber base and avoid alienating users.
| Metric | Formula | What It Tells You |
|---|---|---|
| Delivery Rate | (Delivered / Sent) × 100 | Percentage of messages that reached devices |
| Open Rate | (Opens / Delivered) × 100 | Percentage of delivered messages users tapped |
| Click-Through Rate (CTR) | (Clicks / Delivered) × 100 | Percentage who clicked a specific CTA or link |
| Conversion Rate | (Conversions / Delivered) × 100 | Percentage who completed a goal after delivery |
| Opt-Out Rate | (Unsubscribes / Total Subscribers) × 100 | Percentage who disabled notifications |
From here, you can explore advanced metrics to gain even deeper insights into your campaigns.
Advanced Metrics for Deeper Analysis
Building on basic metrics, diving into advanced ones can uncover the long-term effects of notifications.
Retention Impact
Retention impact focuses on how notifications shape user behavior over time, rather than just tracking immediate clicks. This metric is key to understanding "retention lift" - whether users who receive notifications keep coming back to your app in the following days or weeks. Myroslav Protsan, SEO Specialist at Reteno, notes, "Sending push notifications increases app retention rates by 3 to 10 times".
To measure retention impact, keep an eye on metrics like Daily Active Users (DAU), Monthly Active Users (MAU), and average session duration after campaigns. This helps you see if your notifications are driving ongoing engagement or simply adding to the noise. The shift from focusing on vanity metrics, like impressions, to analyzing deeper engagement patterns is becoming a key part of push notification strategies. Additionally, reviewing error rates can help identify technical issues that might undermine retention benefits.
Error Rate
While retention metrics reveal how users respond, error rates shed light on the technical reliability of your campaigns. This metric tracks delivery failures, helping you pinpoint issues before they disrupt your efforts. Common problems include invalid tokens, expired device IDs, or platform-specific delivery blocks. PushPushGo advises, "Low delivery rates may indicate technical issues... especially if you introduced changes to your website or mobile app that might have interfered with push campaigns settings".
Breaking down error rates by operating system and device manufacturer can help isolate platform-specific problems. High error rates often point to expired or removed push tokens, which can happen when users uninstall your app. Regularly cleaning up your token database by removing inactive tokens can boost delivery rates and ensure your system runs smoothly.
Revenue per Notification
For a direct link between notifications and business performance, look at Revenue per Notification (RPN). This metric reveals the financial impact of each message by calculating the revenue generated per delivered notification. Simply divide the revenue from a campaign by the number of notifications delivered, and track conversions within 24 to 48 hours.
Behavioral triggers, like abandoned cart notifications, tend to deliver the best returns. In fact, 63% of brands report that automated notifications drive the highest revenue. To make tracking easier, set custom conversion goals in your analytics platform and use built-in attribution tools to avoid the hassle of manual integrations.
How to Improve Your Metrics
Once you've tracked your metrics, the next step is to boost performance. Three key strategies can help: personalization, testing, and timing.
Personalization and Segmentation
Did you know that 80% of customers expect brands to provide personalized experiences? Beach Bum Games saw their click-through rates jump from less than 1% to 12% by using behavioral personalization. They tailored notifications based on session duration, quest progress, and play style, which resulted in a 250% increase in engagement and a 140% boost in paid user activation within just 10 days.
Effective personalization starts with segmentation. But instead of relying on broad demographics, focus on user actions. For example, Whisker, the company behind Litter-Robot, segmented over one million customers by purchase history and subscription status. This strategy led to a 20% increase in mobile-driven sales. Similarly, ecommerce brands can target past buyers with complementary products. Bokksu used this approach and increased its Average Order Value by 80% by running segmented campaigns aimed at non-subscribers.
Another essential tactic is deep linking. Notifications should take users directly to the relevant screen - not the app's homepage. This small change reduces drop-offs and encourages users to complete actions. Include clear CTA buttons like "Add to Cart" or "Book Now" so users can act immediately from their lock screens.
While personalization is powerful, A/B testing ensures your messages hit the mark.
A/B Testing
A/B testing is a simple way to understand what resonates with your audience. For instance, Vahdam Teas saw a 374% increase in clicks after experimenting with different variables. The key is to test one element at a time - whether it's the title (keep it under 50 characters), body text (14–25 words), or the CTA button.
To get a full picture of your campaign's impact, track more than just direct clicks. Include metrics like "influenced opens", which measure when a user opens the app shortly after receiving a notification. Monitoring trends over 30, 60, and 90 days can help you identify lasting improvements instead of short-term spikes caused by novelty.
Once you've fine-tuned your message, the next step is to focus on when and how often you deliver it.
Frequency and Timing Optimization
Even the most compelling notification can fail if it arrives at the wrong time. Poorly timed messages are linked to a threefold increase in opt-out rates. Start cautiously by sending 1–2 notifications per week and adjust based on user engagement and opt-out rates.
Leverage send-time optimization to reach users when they're most active. Instead of sending bulk messages, deliver them based on individual activity patterns. For example, Gedi Digital, publisher of La Repubblica, used real-time, API-driven push notifications segmented by topics and authors. This approach led to an 80% year-over-year increase in iOS subscription activations.
Be mindful of quiet hours - typically 10:00 p.m. to 8:00 a.m. - and always schedule notifications according to the user's local time zone. Additionally, consider using behavioral triggers like cart abandonment or level completion. These triggers are highly effective, with 63% of brands reporting the highest ROI from such campaigns.
Key Takeaways
Tracking the right metrics can transform push notifications into a powerful tool for growth. Pay close attention to Delivery Rate, Open Rate, CTR (Click-Through Rate), and Conversion Rate to assess how well your campaigns are performing. Keep an eye on Opt-in and Opt-out rates to spot early signs of user fatigue. These numbers aren't just data points - they reveal how users interact with your messages and how effective your campaigns really are.
"Metrics aren't just numbers - they're insights into what your users truly want and need." - PushPushGo
Use these insights to fine-tune your strategy. Start by crafting personalized, segmented messages that resonate with your audience. Combine this with A/B testing to discover what drives engagement. Timing is critical too - sending notifications outside peak hours (typically between 10:00 a.m. and 2:00 p.m.) can decrease open rates by as much as 40%.
To avoid overwhelming your audience, apply frequency capping to limit how often users receive notifications. Regularly review your metrics to catch issues like declining CTRs or rising opt-out rates before they escalate. Establish a feedback loop that ties delivery performance to key outcomes like revenue and retention. This ensures every notification you send strengthens your connection with users and boosts your campaign’s success.
FAQs
What’s the difference between delivered and confirmed delivery?
Delivered refers to when the push service, such as FCM (Firebase Cloud Messaging), APNs (Apple Push Notification Service), or HMS (Huawei Mobile Services), successfully sends the notification to the user's device.
On the other hand, Confirmed delivery goes a step further. It means the device itself has acknowledged receiving the notification, providing a clearer indication that the message actually reached the user’s device.
To summarize: Delivered tracks the notification's arrival at the push service, while Confirmed delivery ensures the notification was both received and acknowledged by the device.
How do I set up conversion tracking for push notifications?
To track conversions effectively, you'll need a platform capable of monitoring user actions such as purchases or sign-ups. Here's how to get started:
- Define your conversion events: Decide what actions you want to track, like purchases, app sessions, or sign-ups.
- Add tracking code: Use an SDK or API to implement the necessary tracking code within your app or website.
- Activate conversion metrics: Enable the tracking of these metrics in your chosen platform.
- Keep an eye on performance: Use analytics dashboards to monitor how well your campaigns are driving the desired user actions.
By following these steps, you can clearly see how your push notifications impact user behavior.
How often should I send push notifications without causing opt-outs?
To keep users engaged and avoid opt-outs, it's essential to strike the right balance in how often you communicate with them. Sending too many messages can overwhelm your audience, leading to frustration and a spike in unsubscribe rates. Instead, prioritize quality over quantity. Deliver valuable, relevant content at a steady pace to keep your audience interested without crossing the line into annoyance.